
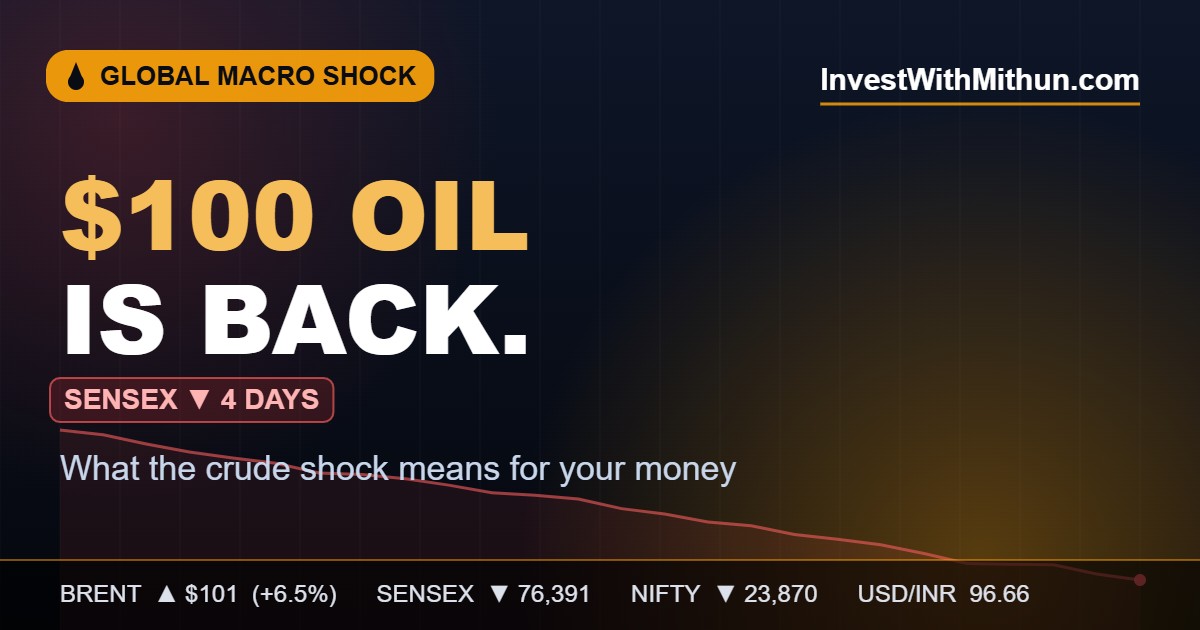
For the first time since May, Brent crude has punched through $100 a barrel — and India’s stock market is feeling every dollar of it. As you read this, the Sensex has closed lower for four straight sessions, the rupee is sitting at a near-record ₹96.66, and lakhs of investors are opening their apps this morning asking the same question: is this the start of something bigger, or a buying opportunity in disguise?
Let me give you the honest answer, the numbers behind it, and a clear playbook — because the crude oil impact on the stock market is one of the few macro forces that touches literally every rupee you own, from your petrol bill to your SIP.
What actually happened: $100 oil in 24 hours
Late Thursday, Yemen’s Houthi rebels fired missiles and drones at two Saudi oil tankers — the Encelia and the Layla — in the Red Sea. The Encelia was hit, catching fire at the bow (the crew is safe). The Houthis then declared a “maritime embargo” on Saudi ports, and at least five Saudi tankers carrying millions of barrels bound for China and India changed course.
The market reaction was instant:
| Benchmark | Latest | Move |
|---|---|---|
| Brent crude | ~$101/bbl | +6.5% (first time above $100 since May) |
| WTI crude | ~$91.50/bbl | +5.4% |
| Brent — month to date | — | +30% in July alone |
Here is the part most headlines miss. Saudi Arabia had already rerouted much of its exports through the Red Sea via its East–West pipeline to avoid the Strait of Hormuz, where Iranian tensions were disrupting flows. Now the Red Sea — the backup route — is under threat too. In one week, the world’s most important oil artery lost both its main valve and its spare. That is why the price moved so violently, and why it may not calm down quickly.
The US, meanwhile, carried out a 12th consecutive night of strikes on Iranian targets. This is no longer a one-day scare; it’s a slow-burning supply shock.
Why it matters in one line: India imports over 85% of the oil it burns. When Brent moves, India’s inflation, its currency and its corporate margins all move with it — usually in the wrong direction for equities.
Why $100 oil hits India harder than almost any other market
If you remember only one idea from this article, make it this: for India, the oil price is a tax on everything.
Here’s the transmission chain, in plain language:
- The import bill balloons. India buys ~5 million barrels a day from abroad. A sustained $10 jump in Brent widens the current account deficit by roughly $13–15 billion — close to 0.4% of GDP.
- The rupee weakens. More dollar demand for oil, plus foreign investors pulling money out, pushes the rupee down. It’s already at ₹96.66 — near an all-time low — which makes every imported item costlier still. A weaker rupee then feeds back into higher fuel costs. It’s a loop.
- Inflation reheats. Fuel and transport costs seep into food, freight and factory-gate prices — threatening the disinflation trend the RBI has been nursing.
- Rate-cut hopes fade. Higher inflation risk means the RBI has less room to cut rates. Markets hate that, because cheaper money underpins the current bull thesis.
- Foreign investors de-risk. Higher oil is textbook “risk-off” for emerging markets. FIIs were already net sellers (–₹819 crore on July 22, with DIIs also selling –₹418 crore).
Four straight down sessions on the Nifty is not a coincidence. It is this chain playing out in real time.
The market scoreboard: where things stand
The July 23 close, before oil made its biggest move overnight:
| Index | Close | Change |
|---|---|---|
| Sensex | 76,391.39 | –363.66 (–0.47%) |
| Nifty 50 | 23,869.60 | –126.65 (–0.53%) |
| Market breadth | 1,569 up vs 2,479 down | Weak |
| Midcaps / Smallcaps | Both ~ –1% | Broad selling |
Fifteen of sixteen major sectors fell. India VIX — the market’s “fear gauge” — ticked up again. This is a market on the back foot, and the overnight oil spike means Friday’s open is likely to stay under pressure.
The levels that matter now (Nifty 50)
- Support: 23,800–23,750 (the 50-day moving average sits here). Below that, 23,500 is the line drawn from the April and June 2026 lows.
- Resistance: 24,000 first, then 24,200.
As long as 23,500 holds, this is a correction inside an uptrend — not a breakdown. Lose 23,500 on a closing basis and the conversation changes.
Winners and losers: the sector map of $100 oil
Not every stock suffers when oil rises. Knowing the difference is where real investors separate from the crowd.
The stocks that hurt
| Sector | Why it’s squeezed | Watch |
|---|---|---|
| Oil marketing (OMCs) | Buy crude high, can’t fully pass costs on → margins compress | BPCL, HPCL, IOC (HPCL fell 2.3% on Jul 23) |
| Aviation | Jet fuel is ~40% of an airline’s cost base | IndiGo, SpiceJet |
| Paints | Crude derivatives are 50%+ of raw material | Asian Paints, Berger |
| Tyres | Crude-linked rubber and carbon black | MRF, Apollo, CEAT |
| FMCG & logistics | Packaging + freight costs rise | Nestlé (–3.1% Jul 23), HUL, Delhivery |
| Cement | Fuel and freight-heavy | UltraTech, Shree Cement |
The stocks that benefit
| Sector | Why it gains | Watch |
|---|---|---|
| Upstream oil & gas | Higher crude = higher realisations on every barrel produced | ONGC, Oil India |
| Refiners / export mix | Wider crack spreads on global product prices | Reliance (refining), select refiners |
| Commodities & defensives | Safe-haven rotation | Gold plays, select FMCG staples |
Notice July 23’s resilient names: Bajaj Auto (+2.6%), M&M (+1.7%), TCS (+1.6%), SBI Life (+2.9%). Autos and IT held up because they are less directly exposed to the oil-inflation loop — a hint of where money hides in a crude shock.
Gold, the rupee and the “safe haven” angle
Long-time readers will remember our deep-dive on why gold behaved so strangely during this same conflict. The picture has shifted again. With oil surging and the rupee weak, MCX gold is back near ₹1.44 lakh per 10g and silver around ₹2.40 lakh per kg — the classic hedge reasserting itself as geopolitical risk deepens.
The rupee at ₹96.66 is the quiet story inside the loud one. A weak currency is a double-edged sword: it hurts importers and inflation, but it quietly helps exporters — one more reason IT and pharma names have held firmer than the index.
How high can oil go? What the big desks are saying
- Goldman Sachs: Brent could top $120 a barrel next quarter if disruptions persist, with a $100 average pencilled in for 2027.
- UBS (Giovanni Staunovo): “Ongoing tensions… and increasing supply disruption risks are skewing price risks to the upside in the short term.”
- RBC Capital (Helima Croft): in a worst-case full regional war, prices could exceed the 2008 peak of $146 — a low-probability, high-impact tail risk, not a base case.
The honest framing: the base case is elevated, volatile oil for weeks, not a permanent $120. But the risk is asymmetric — surprises are more likely to push prices up than down while the Red Sea stays contested.
What smart investors should actually do now
No panic, no heroics. Here is a calm, practical playbook by investor type.
If you’re a long-term SIP investor: Do nothing dramatic. Your SIP is designed for weeks like this — you’re buying more units as prices fall. Corrections driven by geopolitics have historically been among the best times to keep buying. Don’t stop the SIP; if anything, this is when discipline is rewarded.
If you’re a medium-term investor with cash to deploy: Stagger, don’t lunge. Keep some dry powder. Watch the 23,500 Nifty line. Lean toward sectors that are insulated or helped — upstream energy (ONGC), IT (rupee tailwind), select autos — and go slow on oil-sensitive names (paints, aviation, OMCs) until crude stabilises.
If you’re a trader: Respect the levels. 23,750–23,800 is the pivot; 24,000 the cap. Elevated VIX means wider swings — size positions smaller. A single ceasefire headline can gap the market either way overnight.
Everyone: Keep 3–6 months of expenses in cash regardless of the market. Geopolitical shocks are, by definition, unpredictable — your emergency fund is the position that lets you stay calm.
The one-sentence takeaway: $100 oil is a genuine headwind for India — but it’s a macro headwind, not a signal that Indian companies have broken. Corrections like this reward the patient and punish the panicked.
Key takeaways
- Brent crossed $100 (+6.5%) for the first time since May after Houthi attacks on Saudi tankers closed off the Red Sea backup route — with Hormuz already contested.
- India imports 85%+ of its oil, so the shock flows straight into the rupee (₹96.66), inflation, and FII selling — driving four straight down sessions.
- Losers: OMCs, aviation, paints, tyres, FMCG, cement. Winners: upstream (ONGC, Oil India), refiners, and rupee-helped IT/pharma.
- Nifty levels: 23,750–23,800 support, 23,500 the line in the sand; 24,000–24,200 resistance.
- Do: keep SIPs running, stagger fresh buys, favour insulated sectors, hold your emergency fund. Don’t: panic-sell a macro dip.
Frequently Asked Questions
Why did crude oil cross $100 in July 2026?
Yemen’s Houthi rebels attacked two Saudi oil tankers in the Red Sea and declared a maritime embargo on Saudi ports, while the US continued strikes on Iranian targets. Because Saudi Arabia had already rerouted exports through the Red Sea to avoid the tense Strait of Hormuz, both main oil routes are now under threat — triggering a ~6.5% one-day spike in Brent to above $100.
Why does crude oil affect the Indian stock market so much?
India imports over 85% of its crude oil. When prices rise, India’s import bill and current account deficit widen, the rupee weakens, inflation rises, and the RBI has less room to cut interest rates. Foreign investors then pull money out. All of this weighs on equity prices — especially oil-sensitive sectors.
Which sectors fall when oil prices rise?
Oil marketing companies (BPCL, HPCL, IOC), airlines (IndiGo, SpiceJet), paint makers (Asian Paints, Berger), tyre companies (MRF, Apollo, CEAT), FMCG and cement typically suffer because higher crude raises their input, fuel and freight costs.
Which stocks benefit from higher crude oil prices?
Upstream oil producers like ONGC and Oil India benefit because they earn more on every barrel they produce. Integrated refiners and some energy exporters can also gain from wider refining margins, and rupee-sensitive IT and pharma exporters often hold up better.
Should I stop my SIP because the market is falling?
Generally, no. SIPs are built for volatile periods — a falling market means your fixed instalment buys more units. Historically, staying invested through geopolitical corrections has rewarded long-term investors. Stopping a SIP during a dip usually locks in the disadvantage rather than avoiding it.
What are the key Nifty levels to watch right now?
Immediate support is 23,750–23,800 (near the 50-day moving average), with stronger support at 23,500. On the upside, resistance sits at 24,000 and then 24,200. A close below 23,500 would be a warning sign; holding above it keeps the broader uptrend intact.
How high could oil prices go from here?
Goldman Sachs sees Brent potentially topping $120 next quarter if disruptions persist. UBS says risks are skewed to the upside. In a worst-case full regional war, RBC has warned prices could exceed the 2008 record of $146 — but that is a low-probability tail risk, not the base case.
Is this a good time to buy Indian stocks?
For long-term investors, macro-driven corrections often create better entry points than calm markets. The disciplined approach is to stagger purchases, keep some cash in reserve, favour sectors insulated from oil, and avoid trying to catch the exact bottom.
Written by Mithun Srivastava for InvestWithMithun.com. This article is for information and education only and is not investment advice. Oil prices and market levels are moving fast during this developing situation; figures reflect the July 23–24, 2026 window and may change. Always do your own research or consult a SEBI-registered advisor before investing.
For more market breakdowns like this, explore our trending finance coverage.
Try the tools every reader saves
Free. No signup. Built for Indian investors.